
Analytics mindset
Oh Canada
Case 2: Basic SQL
Overview
Most accounting data is stored in one or more relational databases. To work with the data — whether extracting, transforming or loading the data — accountants frequently need to write SQL code. SQL stands for Structured Query Language. It is a basic programming language that allows you to work with data stored in a database. Thus, SQL becomes an important part of the extract, transform and load (ETL) process in dealing with data. The ETL process is part of an analytics mindset. As a reminder, an analytics mindset is the ability to:
Ask the right questions
Extract, transform and load relevant data
Apply appropriate data analytics techniques
Interpret and share the results with stakeholders
Because of the ubiquitous nature of SQL, there are numerous resources available to learn the basic syntax of this language. Thus, this case does not review the basics of SQL. Rather, this case focuses on using SQL to answer basic questions. If you would like to learn SQL, we recommend reviewing the lessons under the heading “SQL Tutorial” available at https://www.w3schools.com/sql/.
Your data
Canadian government workers are required by law to document travel-related expenses. The government collects the travel information and makes it available at https://open.canada.ca/data/en/dataset/009f9a49-c2d9-4d29-a6d4-1a228da335ce. The case incorporates this data with simulated data to provide a rich data environment (over 200,000 lines of data). Therefore, you should consider this data fictional, and you should not extrapolate or project findings from this data set on the real world.
The data has been extracted, transformed and loaded into a Microsoft Access data set. The data set is provided to you in the Microsoft Access file, Analytics_mindset_case_studies_OhCanada2.accdb. A basic schema for this data is included in the image on the following page.
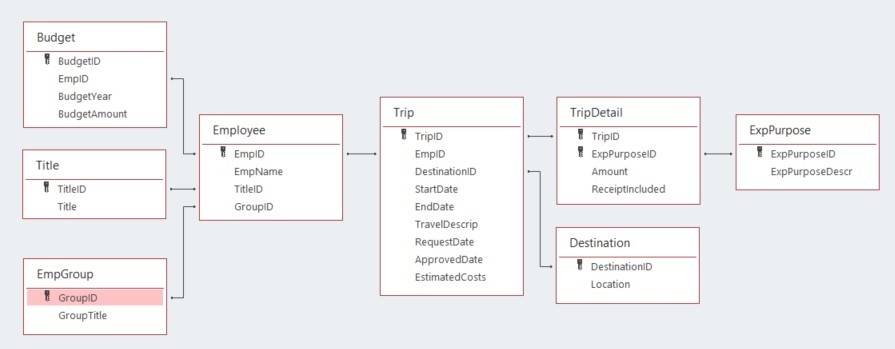
The following are descriptions of each of the fields contained in the database. Fields are separated by table. The ID fields (i.e., BudgetID, TitleID, GroupID) are not separately defined; they comprise integers that uniquely identify the rows in each table. Each ID field functions as a primary or foreign key for the database.
Budget:
BudgetYear: the four-digit year that corresponds to the annual budget year for an employee
BudgetAmount: an employee’s annual budget amount
Title:
Title: a description of each employee title
EmpGroup:
GroupTitle: a description of each employee group
Employee:
EmpName: the first and last names of each employee
Trip:
StartDate: the beginning date for employee travel
EndDate: the ending date for employee travel
TravelDescript: a description provided by the employee of their travel
RequestDate: the date an employee requested permission to travel
ApprovedDate: the date a supervisor approved the employee’s travel
EstimatedCosts: the employee’s estimated amount the trip would cost made at the time they requested permission to travel
TripDetail:
Amount: the dollar amount of costs for the employee incurred for each purpose on each trip
ReceiptIncluded: a dummy variable that is equal to “Y” if the employee included a receipt and “N” if the employee did not include a receipt
Destination:
Location: a country description of the primary location for the travel (While employees can travel to multiple locations on a trip, only the first destination of the trip is recorded.)
ExpPurpose:
ExpPurposeDescr: a description of each category of employee expenses
Required
Your task is to answer each of the following questions using the Microsoft Access file provided for this case and submit the answers in a Word document for grading. Save your document as OhCanada2_FirstNameLastName.docx. As you answer the questions, make sure to:
Carefully label the output columns as specified in the images.
Include the columns in the order specified in the images of the output header shown in each problem.
Sort the data as specified in the problem.
List the number of rows that returned from executing the query.
The SQL for all of these problems will start with a SELECT statement and end with a semicolon.
Write a query to list all data in the Trip table. Sort the data in ascending order by TripID. Record the number of rows your query produces. The output header should look like this:

SQL:
Number of rows:
Write a query to list employee numbers and employee names for all employees in the organization. Record the number of rows your query produces. Sort the data in ascending order by EmpID. The output header should look like this:

SQL:
Number of rows:
For only 2020 budgets, write a query to list the employee ID, budget amount and budget year for all employees in the organization. Sort the data by budgeted amount (descending). Record the number of rows your query produces. The output header should look like this:

SQL:
Number of rows:
Write a query to list all transaction details for trips where the transaction amount is greater than $100 and a receipt was not included. Sort the data by amount (descending). Record the number of rows your query produces. The output header should look like this:

SQL:
Number of rows:
Write a query to show the total estimated travel costs for each employee in the data set. Sort the data by total costs (descending) and then by employee ID (ascending). Record the number of rows your query produces. The output header should look like this:

SQL:
Number of rows:
Write a query to show the total actual travel costs in the data set. Record the number of rows your query produces. The output header should look like this:

SQL:
Number of rows:
Write a query to show the average travel costs for transactions with and without a receipt. Sort the data by whether there was a receipt or not (ascending). Record the number of rows your query produces. The output header should look like this:

SQL:
Number of rows:
Write a query to show the total amount of funds requested (i.e., estimated costs) for travel for each year. Use the year of the start date of the travel for estimating the answer. Sort by year in descending order. Record the number of rows your query produces. The output header should look like this:

SQL:
Number of rows:
Write a query to calculate the highest and lowest estimated amounts for a trip in the entire data set. Record the number of rows your query produces. The output header should look like this:

SQL:
Number of rows:
Write a query to show each employee name and their title for everyone in the data set. Sort the data by employee name (ascending). Record the number of rows your query produces. The output header should look like this:

SQL:
Number of rows:
Write a query to list all employee groups and the employees who belong to those groups. Include groups even if no employees are assigned to them. Sort the data by GroupID (descending) and EmpName (descending). Record the number of rows your query produces. The output header should look like this:

SQL:
Number of rows:
Write a query to create a list of all possible combinations of titles and group titles. Sort the data by title (descending) and then by group title (descending). Record the number of rows your query produces. The output header should look like this:

SQL:
Number of rows:
Write a query to list the employee ID and total actual costs those employees incurred in traveling. Sort the data by total costs (descending) and then by employee ID (ascending). Record the number of rows your query produces. The output header should look like this:

SQL:
Number of rows:
Write a query to list the descriptions of expenses (i.e., ExpPurposeDescr) that have more than 50,000 transactions incurred. Sort the data by the number of transactions (descending). Record the number of rows your query produces. The output header should look like this:

SQL:
Number of rows:
Write a query to list the employee name and the total number of trips that had estimated costs over $1,000. Sort the data by the number of trips over $1,000 (descending) and then by employee name (ascending). Record the number of rows your query produces. The output header should look like this:

SQL:
Number of rows:
For employees whose average estimated trip cost for the period of 2017 to 2020 (inclusive) exceeded $10,000, write a query to list the employee name, the total number of trips and the average estimated trip cost. Use the StartDate field for trip period. Sort the data by the number of trips (descending) and then by the average estimated costs of the trips (descending). Record the number of rows your query produces. The output header should look like this:

SQL:
Number of rows:
Write a query to list each employee name, their title and their group title. Sort the data by employee name (ascending). Record the number of rows your query produces. The output header should look like this:

SQL:
Number of rows:
Write a query to list each employee name and the total amount they actually spent on travel. Sort the data by how much they actually spent (descending) and then by employee name (ascending). Record the number of rows your query produces. The output header should look like this:

SQL:
Number of rows:
Write a query to show a list of all trips by employees that have an estimated trip cost greater than the average estimated costs of all trips. Sort the data by employee name (ascending) and then by estimated trip costs (descending). Record the number of rows your query produces. The output header should look like this:

SQL:
Number of rows:
Write a query to show all trips in 2020 where the total actual costs were more than twice as expensive as the estimated costs. Sort the data by the difference in total costs less the estimated costs so that the highest difference is listed first. As a hint, you must compute the total actual costs as the sum of all costs in the TripDetail table, regardless of the purpose of the cost. Record the number of rows your query produces. The output header should look like this:

SQL:
Number of rows: